Showing posts with label Technology. Show all posts

3 command-line music players for Linux


One perception that Linux can't seem to shake off is that you can't do anything without using the command line. A number of people in my circle have been using Linux effectively for years, and they've yet to crack open a terminal window.
Having said that, working at the command line can make certain tasks faster and more efficient. If you're using older hardware, command-line tools are an excellent alternative to graphical applications since they don't use too many resources.
One of those tasks playing music. You can do that in a terminal. How? Here's a look at three command-line music players.

cmus

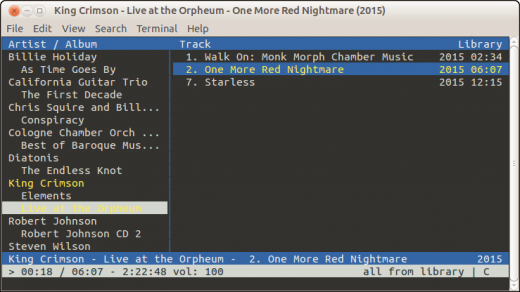
cmus is a fast and flexible music player. It organizes your music by either musician or album title, and lets you load playlist files. You can also use cmus' built-in search function to look for music in your /home directory and you can switch between several different layouts.
If you're a fan of the vi editor, you'll be right at home in cmus. It uses keyboard shortcuts inspired by vi (for example, :add ~/music to load a folder) and you manuever through tracks by pressing the j and k keys.

MOC

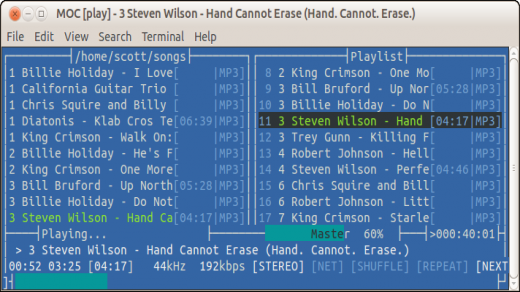
MOC (short for Music on Console) is a dual-pane music player that's similar to cmus. The left pane lists the tracks in a folder, while the right pane contains the contents of a playlist file (if there is one in the folder).
Working with your music is simple. MOC's keyboard shortcuts are quite intuitive. How intuitive? You press n to play the next track in your list or p to play the previous one, and press S to set MOC to shuffle tracks.


mpg123 and ogg123

If you want a quick and dirty way to play music files, then mpg123 and ogg123 are good options. I've lumped them together because both applications are very similar. In fact, the only difference between the two applications is the file formats they support.
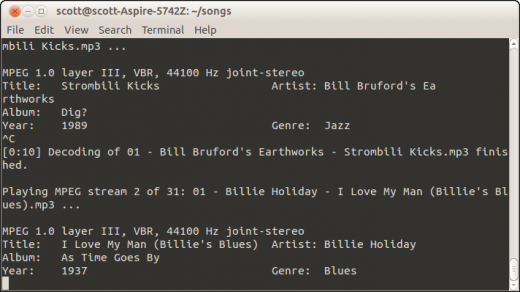
mpg123 has no frills. Just go to the folder containing the MP3 files that you want to play and type mpg123 *.mp3. You can also load a playlist file and use the *-z* option on the command line to shuffle the tracks you want to play.


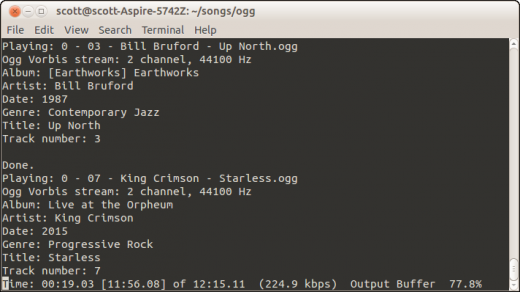
If you're adamant about using truly open formats, then you'll want to go with Ogg Vorbis for your music. That's where ogg123 comes in. ogg123 is part of a suite of applications called vorbis-tools, which comes pre-installed with a number of Linux distributions.
ogg123 works in exactly the same way, and uses the same options, as mpg123. Just substitute .ogg or .oga for .mp3 when specifying the files you want to play.


(Note: An upcoming article will look at command-line tools for converting between audio formats.)

Bonus tool: ripit

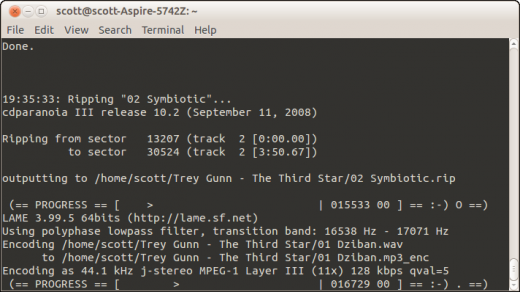
ripit isn't a music player, but it can help you feed your music player. It's a script that works with a number of utilities and audio encoders—like cdparanoia, cdda2wav, Ogg Vobis, and LAME—to convert the tracks on a CD to files on your hard drive.
You can rip your CDs to several formats including MP3, Ogg, MP4, and FLAC. The script walks you through the ripping process, and will even grab information about the CD from CDDB or MusicBrainz (two online repositories of music metadata). If ripit can't find the CD's metadata online, it lets you enter that information yourself. You can also tell ripit which tracks on a CD that you want, rather than ripping all of the songs on the disc.

Use Proxychains To Evade Detection in Kali Linux 2016

The most important thing about doing penetration testing is anonymity, undetectable, or at least hard to be detected. The worst thing that can happen to any pentesters is being detected by a security admin, the security technologies such as IDS, firewall, etc., or a forensic investigator. We need more additional tools in order to hide our identity being exposed, VPN (Virtual Private Network) and Proxyservers are the most famous tools nowdays, but several considering RDP (Remote Desktop Protocol) as their main guard of their identity. In this article, i will discussing about a built-in anonimity service in Kali Linux and or others penetration testing based machine, that is Proxychains.
Disclaimer – Our tutorials are designed to aid aspiring pen testers/security enthusiasts in learning new skills, we only recommend that you test this tutorial on a system that belongs to YOU. We do not accept responsibility for anyone who thinks it’s a good idea to try to use this to attempt to hack systems that do not belong to you
Whenever we send a packet to any hostnames or targets, that packet contains our IP address in the IP header. If we make a TCP connection, the target or hostname system will log our IP address as it logs all connections. These events increase the possibility of detection. In order to penetrate anonymously with the least chance of detection, we need to use an intermediary machine whose IP address will be left on the target system. This can be done by using proxies.
These systems are designed to accept our traffic and then forward it on to the hostname or target. Of course, the proxy will likely log our traffic, but an investigator would have to get a subpoena or search warrant to obtain the logs.
If we string multiple proxies in a chain, we make it harder and harder to detect our original IP address. If one of those proxies is outside the jurisdiction of the victim, it makes it very unlikely that any traffic can be attributed to our IP address. It is not as hard as you imagr to setup proxies chaining. Kali Linux, backbox and others penetration testing OS’s certaintly have an excellent built in tool for proxifying our traffic called proxychains.

Proxychains Features:

  1. The latest version of Proxychains support SOCKS5, SOCKS4, and HTTP CONNECT proxy servers.
  2. Proxychains can be mixed up with a different proxy types in a list
  3. Proxychains also supports Any kinds of chaining option methods, like: random, which is it takes random proxy in the list stored in configuration file. or chaining proxies in the exact order list, different proxies are separated by new line in a file. or dynamic option, that let Proxychains to go through the live only proxies, it will exclude the dead or unreachable proxies, the dynamic option often called smart option.
  4. Proxychains could run or handle any TCP client application, ie., nmap.
Instead of scanning or do  multiple requests to any target directly using our IP, we can let Proxychains to cover up our identities. By adding command “proxychains” for every jobs, thats mean we enable Proxychains service. For example; we want to scan any webservers in a range of our local network by using Proxychains,or scan specific target by its URL hostname  or IP. so type in:
<span style="color: #00ff00">proxychains nmap -sT -P0 -p 80 -iR 192.168.1.0/24</span> 

Step 1: Look at Proxychains files

Let’s start by finding proxychains. Type:
root@kali:~# locate proxychains
pr1
As we can see in the screenshot above, above the highlighted output, proxychains is in the /usr/bin directory. Since/usr/bin is in our PATH variable, we can use it from any directory. This is just as we would want since we use proxychains with other commands, which may NOT likely be in the PATH variable.

Step 2: Proxychains Syntax

The syntax for the proxycahins command is simple and straightforward.
root@kali:~# proxychains [the command you want proxied] [any arguments]
So, if I wanted to use proxychains to scan a site with nmap anonymously, I could type:
root@kali:~# proxychains nmap -sS [IP address or URL]

Step 3: Setup the Configuration File

Like nearly every application in Linux/Unix, configuration is managed by a simple text file called the config file. In the case of proxychains, this file is /etc/proxychains.conf. We can open it in leafpad or any other text editor (vi, emacs, gedit, kwrite, etc.), by typing:
root@kali:~# leafpad /etc/proxychains.conf
When we do so, we will see a file like that displayed below. If we scroll down this file a bit, we will see a section that I have highlighted labeled “add proxy list here…”.
pr2
You can get IP proxy lists for free in HideMyAss. Visit the link, and scroll down the webpage until you see the proxy list detail.
pr3
To get proxychains to use intermediary proxies, we simply need to add the IP addresses of the proxies we want to use here. It’s important to note that proxychains defaults to use Tor. Notice the last line in the screenshot above. It directs proxychains to send the traffic first through our host at 127.0.0.1 on port 9050 (the default Tor configuration). If you are using Tor, leaves this as it is. If you are not using Tor, you will need to comment out this line.
As much as I like Tor, it is very slow and we now know that the NSA has broken Tor, so I am much less likely to depend upon it for anonymity.

 Step 4: Let’s Test Proxychains

Now that we have put a proxy between us and any traffic we send, let’s test it out. In this case, I am simply going to do an nmap scan to site.com anonymously by sending the scan through a proxy. The command would be as follows:
root@kali:~# proxychains nmap -sS -T4 -v www.site.com
pr4
As you can see in the screenshot above, I have successfully scanned site.com through my chosen proxy and returned the results back to me. In this way, it appears that my proxy scanned site.com and not my IP address.
Now that we have proxychains working, let’s look at some options that we can configure through the proxychains.conf. As we now have it set up, we are simply using a single proxy. We can put in numerous proxies and use all of them, we can use a limited number from the list, or we can have proxychains change the order randomly. Let’s try all of those options.

Step 5: Add More Proxies

First, let’s add some more proxies to our list. Open /etc/proxychains.conf and add more proxy IPs like I’ve done below
pr5

Dynamic Chaining (Smart Chaining)

Now that we have multiple IPs in our proxychain.conf we can set up dynamic chaining. Dynamic chaining will enable us to run our traffic through every proxy on our list, and if one of the proxies is down or not responding, it will automatically go to the next proxy in the list without throwing an error.
To do so, let’s first open the proxychains configuration file again.
With this file open, uncomment out the “dynamic_chains” line. This will enable dynamic chaining of our proxies allowing for greater anonymity and trouble-free hacking.
pr6

Random Chaining

Finally, we can also use “random chaining”. With this option, proxychains will randomly choose IP addresses from our list and use them for creating our proxychain. This means that each time we use proxychains, the chain of proxy will look different to the target, making it harder to track our traffic from its source.
To do so, open the /etc/proxychains.conf file and comment out “dynamic chains” and uncomment “random chain”. Since we can only use one of these options at a time, make certain that you comment out the other options in this section before using proxychains.
pr7
In addition; you may want to uncomment the line with “chain_len”. This will determine how many of the IP addresses in your chain will be used in creating your “random proxy chain”. And also if you got error cause of proxy DNS requests, you might to comment out “proxy_dns” option.
pr8
Now that you know how to use proxychains, you can do your penetration testing with relative anonymity. I say relative, because there is no surefire way to remain anonymous with the NSA spying on all our activity. All we can do is make detection much harder, and proxychains can help do this for us.

How to Build Your First Slack Bot with Python 2016

Bots are a useful way to interact with chat services such as Slack. If you have never built a bot before, this post provides an easy starter tutorial for combining the Slack API with Python to create your first bot.
We will walk through setting up your development environment, obtaining a Slack API bot token and coding our simple bot in Python.

Tools We Need

Our bot, which we will name "StarterBot", requires Python and the Slack API. To run our Python code we need:
It is also useful to have the Slack API docs handy while you're building this tutorial.
All the code for this tutorial is available open source under the MIT license in the slack-starterbot public repository.

Establishing Our Environment

We now know what tools we need for our project so let's get our development environment set up. Go to the terminal (or Command Prompt on Windows) and change into the directory where you want to store this project. Within that directory, create a new virtualenv to isolate our application dependencies from other Python projects.
virtualenv starterbot
Activate the virtualenv:
source starterbot/bin/activate
Your prompt should now look like the one in this screenshot.
Command prompt with starterbot's virtualenv activated.
The official slackclient API helper library built by Slack can send and receive messages from a Slack channel. Install the slackclient library with the pip command:
pip install slackclient
When pip is finished you should see output like this and you'll be back at the prompt.
Output from using the pip install slackclient command with a virtualenv activated.
We also need to obtain an access token for our Slack team so our bot can use it to connect to the Slack API.

Slack Real Time Messaging (RTM) API

Slack grants programmatic access to their messaging channels via a web API. Go to the Slack web API page and sign up to create your own Slack team. You can also sign into an existing account where you have administrative privileges.
Use the sign in button on the top right corner of the Slack API page.
After you have signed in go to the Bot Users page.
Custom bot users webpage.
Name your bot "starterbot" then click the “Add bot integration” button.
Add a bot integration named starterbot.
The page will reload and you will see a newly-generated access token. You can also change the logo to a custom design. For example, I gave this bot the Full Stack Python logo.
Copy and paste the access token for your new Slack bot.
Click the "Save Integration" button at the bottom of the page. Your bot is now ready to connect to Slack's API.
A common practice for Python developers is to export secret tokens as environment variables. Export the Slack token with the name SLACK_BOT_TOKEN:
export SLACK_BOT_TOKEN='your slack token pasted here'
Nice, now we are authorized to use the Slack API as a bot.
There is one more piece of information we need to build our bot: our bot's ID. Next we will write a short script to obtain that ID from the Slack API.

Obtaining Our Bot’s ID

It is finally time to write some Python code! We'll get warmed up by coding a short Python script to obtain StarterBot's ID. The ID varies based on the Slack team.
We need the ID because it allows our application to determine if messages parsed from the Slack RTM are directed at StarterBot. Our script also tests that our SLACK_BOT_TOKEN environment variable is properly set.
Create a new file named print_bot_id.py and fill it with the following code.
import os
from slackclient import SlackClient


BOT_NAME = 'starterbot'

slack_client = SlackClient(os.environ.get('SLACK_BOT_TOKEN'))


if __name__ == "__main__":
    api_call = slack_client.api_call("users.list")
    if api_call.get('ok'):
        # retrieve all users so we can find our bot
        users = api_call.get('members')
        for user in users:
            if 'name' in user and user.get('name') == BOT_NAME:
                print("Bot ID for '" + user['name'] + "' is " + user.get('id'))
    else:
        print("could not find bot user with the name " + BOT_NAME)
Our code imports the SlackClient and instantiates it with our SLACK_BOT_TOKEN, which we set as an environment variable. When the script is executed by the python command we call the Slack API to list all Slack users and get the ID for the one that matches the name "starterbot".
We only need to run this script once to obtain our bot’s ID.
python print_bot_id.py
The script prints a single line of output when it is run that provides us with our bot's ID.
Use the Python script to print the Slack bot's ID in your Slack team.
Copy the unique ID that your script prints out. Export the ID as an environment variable named BOT_ID.
(starterbot)$ export BOT_ID='bot id returned by script'
The script only needs to be run once to get the bot ID. We can now use that ID in our Python application that will run StarterBot.

Coding Our StarterBot

We've got everything we need to write the StarterBot code. Create a new file named starterbot.py and include the following code in it.
import os
import time
from slackclient import SlackClient
The os and SlackClient imports will look familiar because we used them in the print_bot_id.py program.
With our dependencies imported we can use them to obtain the environment variable values and then instantiate the Slack client.
# starterbot's ID as an environment variable
BOT_ID = os.environ.get("BOT_ID")

# constants
AT_BOT = "<@" + BOT_ID + ">:"
EXAMPLE_COMMAND = "do"

# instantiate Slack & Twilio clients
slack_client = SlackClient(os.environ.get('SLACK_BOT_TOKEN'))
The code instantiates the SlackClient client with our SLACK_BOT_TOKEN exported as an environment variable.
if __name__ == "__main__":
    READ_WEBSOCKET_DELAY = 1 # 1 second delay between reading from firehose
    if slack_client.rtm_connect():
        print("StarterBot connected and running!")
        while True:
            command, channel = parse_slack_output(slack_client.rtm_read())
            if command and channel:
                handle_command(command, channel)
            time.sleep(READ_WEBSOCKET_DELAY)
    else:
        print("Connection failed. Invalid Slack token or bot ID?")
The Slack client connects to the Slack RTM API WebSocket then constantly loops while parsing messages from the firehose. If any of those messages are directed at StarterBot, a function named handle_command determines what to do.
Next add two new functions to parse Slack output and handle commands.
def handle_command(command, channel):
    """
        Receives commands directed at the bot and determines if they
        are valid commands. If so, then acts on the commands. If not,
        returns back what it needs for clarification.
    """
    response = "Not sure what you mean. Use the *" + EXAMPLE_COMMAND + \
               "* command with numbers, delimited by spaces."
    if command.startswith(EXAMPLE_COMMAND):
        response = "Sure...write some more code then I can do that!"
    slack_client.api_call("chat.postMessage", channel=channel,
                          text=response, as_user=True)


def parse_slack_output(slack_rtm_output):
    """
        The Slack Real Time Messaging API is an events firehose.
        this parsing function returns None unless a message is
        directed at the Bot, based on its ID.
    """
    output_list = slack_rtm_output
    if output_list and len(output_list) > 0:
        for output in output_list:
            if output and 'text' in output and AT_BOT in output['text']:
                # return text after the @ mention, whitespace removed
                return output['text'].split(AT_BOT)[1].strip().lower(), \
                       output['channel']
    return None, None
The parse_slack_output function takes messages from Slack and determines if they are directed at our StarterBot. Messages that start with a direct command to our bot ID are then handled by our code - which is currently just posts a message back in the Slack channel telling the user to write some more Python code!
Here is how the entire program should look when it's all put together (you can also view the file in GitHub):
import os
import time
from slackclient import SlackClient


# starterbot's ID as an environment variable
BOT_ID = os.environ.get("BOT_ID")

# constants
AT_BOT = "<@" + BOT_ID + ">:"
EXAMPLE_COMMAND = "do"

# instantiate Slack & Twilio clients
slack_client = SlackClient(os.environ.get('SLACK_BOT_TOKEN'))


def handle_command(command, channel):
    """
        Receives commands directed at the bot and determines if they
        are valid commands. If so, then acts on the commands. If not,
        returns back what it needs for clarification.
    """
    response = "Not sure what you mean. Use the *" + EXAMPLE_COMMAND + \
               "* command with numbers, delimited by spaces."
    if command.startswith(EXAMPLE_COMMAND):
        response = "Sure...write some more code then I can do that!"
    slack_client.api_call("chat.postMessage", channel=channel,
                          text=response, as_user=True)


def parse_slack_output(slack_rtm_output):
    """
        The Slack Real Time Messaging API is an events firehose.
        this parsing function returns None unless a message is
        directed at the Bot, based on its ID.
    """
    output_list = slack_rtm_output
    if output_list and len(output_list) > 0:
        for output in output_list:
            if output and 'text' in output and AT_BOT in output['text']:
                # return text after the @ mention, whitespace removed
                return output['text'].split(AT_BOT)[1].strip().lower(), \
                       output['channel']
    return None, None


if __name__ == "__main__":
    READ_WEBSOCKET_DELAY = 1 # 1 second delay between reading from firehose
    if slack_client.rtm_connect():
        print("StarterBot connected and running!")
        while True:
            command, channel = parse_slack_output(slack_client.rtm_read())
            if command and channel:
                handle_command(command, channel)
            time.sleep(READ_WEBSOCKET_DELAY)
    else:
        print("Connection failed. Invalid Slack token or bot ID?")
Now that all of our code is in place we can run our StarterBot on the command line with the python starterbot.py command.
Console output when the StarterBot is running and connected to the API.
In Slack, create a new channel and invite StarterBot or invite it to an existing channel.
In the Slack user interface create a new channel and invite StarterBot.
Now start giving StarterBot commands in your channel.
Give StarterBot commands in your Slack channel.

Wrapping Up

Alright, now you've got a simple StarterBot with a bunch of places in the code you can add whatever features you want to build.
There is a whole lot more that could be done using the Slack RTM API and Python. Check out these posts to learn what you could do:
Questions? Contact me via Twitter @mapanedex

Run a command or script after running apt-get command on a Debian or Ubuntu 2016

run custom command after 'apt-get upgrade' or 'apt-get dist-upgrade' on a Debian or Ubuntu Linux based system? How do I hook a script to apt-get command on my Ubuntu Linux server?

You can configure the apt-get command using /etc/apt/apt.conf file or place configuration in a special directory at /etc/apt/apt.conf.d/. The following two options allows you to run shell commands or script before/after invoking dpkg/apt-get tools:

DPkg::Post-Invoke

The syntax is:
 
# This is a list of shell commands to run after invoking dpkg/apt-get #
DPkg::Post-Invoke {"command";};
DPkg::Post-Invoke {"/path/to/sbin/command";};
DPkg::Post-Invoke {"/path/to/script";};
 

DPkg::Pre-Invoke

The syntax is:
 
# This is a list of shell commands to run before invoking dpkg/apt-get #
DPkg::Pre-Invoke {"command";};
DPkg::Pre-Invoke {"/path/to/sbin/command";};
DPkg::Pre-Invoke {"/path/to/script";};
 
Like options this must be specified in list notation. The commands are invoked in order using /bin/sh; should any fail APT will abort.

Examples

In this example auto re-mounting of a readonly /use/ folder so that apt-get will work properly. Edit or create a file called /etc/apt/apt.conf.d/100update:
$ sudo vi /etc/apt/apt.conf.d/100update
Append/edit as follows:
 
   Pre-Invoke {"/bin/mount -o remount,rw /usr/";};
   Post-Invoke {"/bin/mount -o remount,ro /usr/";};
 
Another example:
 
  Update
  {
     Pre-Invoke {"touch /var/lib/apt/pre-update-stamp"; };
     Post-Invoke {"touch /var/lib/apt/post-update-stamp"; };
  };
 

Running or hooking a custom script to apt-get on a Debian or Ubuntu Linux server

In this example I want to run the following script (/root/bin/php7helper) so that I can patch config file upon running apt-get command:
#!/bin/bash
# Name: /root/bin/php7helper
# Purpose: A shell script to patch php 7 fpm on Ubuntu serer
# Author: Vivek Gite <www.cyberciti.biz> under GPL version 2+
# ------
function update_php7(){
 local u="cyberciti"  # new user name
 local r="www-data"   # old user name
 local f="/usr/lib/tmpfiles.d/php7.0-fpm.conf" # config file
 local wrcmd="/etc/init.d/lighttpd restart"    # restart services
 local prcmd="/etc/init.d/php7.0-fpm restart"
 # patch it
 echo "$0: Patching $f..."
 sed -i "s/$r/$u/g" $f
 # restart it
 $prcmd
 $wrcmd
}
# main #
update_php7
 
Create a file called /etc/apt/apt.conf.d/80upgradehook:
$ cat /etc/apt/apt.conf.d/80upgradehook
Sample outputs:
 
DPkg::Post-Invoke {"/root/bin/php7helper";}; 
 
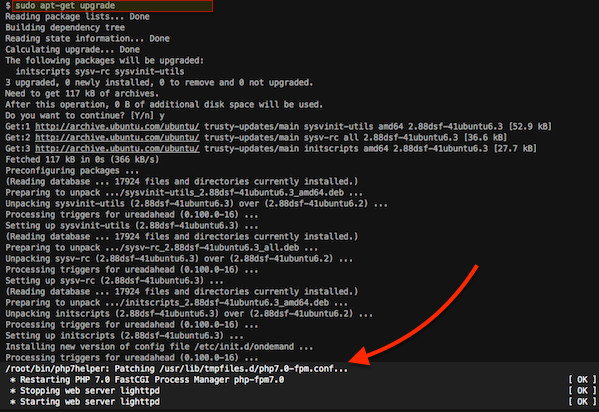
Now simply run the apt-get upgrade command and the script /root/bin/php7helper will get executed:
$ sudo apt-get upgrade
Sample outputs:

See man pages for more info - apt-get(8)apt.conf(5)dpkg(1)

Install Terminal Retro On Another Linux 2016

Install cool-retro-term in Ubuntu based Linux distributions


To install cool-retro-term in Ubuntu based Linux distributions, such as Linux Mint, elementary OS, Linux Lite etc, use the PPA below:
sudo add-apt-repository ppa:noobslab/apps
sudo apt-get update
sudo apt-get install cool-retro-term

Install cool-retro-term in Arch based Linux distributions

Installing cool-retro-term in Arch based Linux distributions such as Antergos andManjaro, use the following command:
sudo pacman -S cool-retro-term

Install cool-retro-term from source code

For installing this application from source code, you need to install a number of dependencies first. Some of the know dependencies in Ubuntu based distributions are:
sudo apt-get install git build-essential qmlscene qt5-qmake qt5-default qtdeclarative5-dev qtdeclarative5-controls-plugin qtdeclarative5-qtquick2-plugin libqt5qml-graphicaleffects qtdeclarative5-dialogs-plugin qtdeclarative5-localstorage-plugin qtdeclarative5-window-plugin 

Known dependencies for other distributions can be found on the github of cool-retro-term.
Now use commands below to compile the program:
git clone https://github.com/Swordfish90/cool-retro-term.git
cd cool-retro-term
qmake && make
Once the program is compiled, you can run it with this command:
./cool-retro-term
If you like to have this app in program menu for quick access so that you won’t have to run it manually each time with the commands, you can use the command below:
sudo cp cool-retro-term.desktop /usr/share/applications
You can learn some more terminal tricks here. Enjoy the vintage terminal in Linux :)

Introduction to Windows shellcode development – Part 2 2016

If you missed the first part of this series, where you can read about what is a shellcode and how it works, you can find it here: Part I. In this part, I will cover required information in order to be able to properly write a shellcode for Windows platform: the Process Environment Block, the format of Portable Executable files and a short introduction to x86 Assembly. This article will not cover all the aspects of these concepts, but it should be enough in order to properly understand shellcodes.

Process Environment Block

Within Windows operating system, PEB is a structure available for every process at a fixed address in memory. This structure contains useful information about the process such as: the address where the executable is loaded into memory, the list of modules (DLL), a flag specifying if the process is being debugged and many others.
It is important to understand that the structure is intended to be used by the operating system. It is not consistent across different Windows system versions, so it may change with each new Windows release, but some common information has been kept.
As we discussed in the first article, the DLLs (due to ASLR) will be loaded at different memory addresses so we cannot use fixed memory addresses in our shellcode. But we can use this structure, found at a fixed memory address, in order to find the location of DLLs into memory.
If you are familiar with C/C++, it is pretty easy to understand what information does this structure contains and where. The official Microsoft documentation shows the following fields:

As you can see, some fields called “Reserved” are not described but some other fields are documented.
For those unfamiliar with C/C++, you have to understand this: a BYTE means… a byte, aPVOID is a pointer (a memory address) – so it is 4 bytes on a x86 system (32 bit system) and PPEB_LDR_DATA is a pointer to a custom structure called PEB_LDR_DATA. There are two bytes reserved for the first field (because Reserved1[2] is an array of two BYTEs), the BeingDebugged flag is 1 byte followed by another byte (Reserved2). Reserved3[2] is an array with 2 pointers (so 2 * 4 bytes = 8 bytes) and Ldr is a pointer – 4 bytes.
From this structure, we will use the Ldr pointer, witch we can find at offset 12 (or 0xC) within the structure (2 bytes Reserved1 + 1 byte BeingDebugged + 1 byte Reserved2 + 8 bytes Reserved3).
The PEB_LDR_DATA contains the following information:
We will act as before. We can access the InMemoryOrderModuleList field at offset 20 (0x14 in hex: 8 bytes Reserved1 + 3 * 4 bytes Reserved2). This field will give use information about loaded DLLs.
Here things are a bit more complicated. We can get loaded DLLs information using a structure called LDR_DATA_TABLE_ENTRY. The official Microsoft documentation does not publish the whole structure contents but we can find more information here:

The LIST_ENTRY structure is a simple double linked list, containing a pointer to next element (Flink) and a pointer to previous element (Blink), each one having 4 bytes:
The InMemoryOrderModuleList field is a pointer to a LIST_ENTRY field of a LDR_DATA_TABLE_ENTRY structure. It is NOT a pointer to the beginning of theLDR_DATA_TABLE_ENTRY structure, it is a pointer to the InMemoryOrderLinks field of the structure! As you can see, Flink and Blink are pointers to a LIST_ENTRY structure.
Let’s take it step by step:
  1. Read the PEB structure
  2. Go to offset 0xC to Ldr pointer
  3. Go to offset 0x14 to InMemoryOrderModuleList field
At this moment we are placed on the InMemoryOrderLinks element of the first module loaded into memory. This module is the executable file (for example calc.exe). We want to navigate through all loaded DLLs. InMemoryOrderLinks, being a LIST_ENTRY structure – where first 4 bytes are the Flink pointer and the next 4 bytes are the Blink pointer, allows us to navigate to the second loaded module through the first 4 bytes. We need to do this one more time and we can access information about the third loaded module.
The InMemoryOrderModuleList list offers us a list of all loaded modules in the following order:
  1. calc.exe (the executable)
  2. ntdll.dll
  3. kernel32.dll
As we discussed in the first article, we need access to kernel32.dll in order to access function like GetProcAddress and LoadLibrary that will help us to call any Windows APIfunction.
In order to finish our goal, we have to read the DllBase field (the memory location where the DLL is loaded into memory) from the current LDR_DATA_TABLE_ENTRY structure. The DllBase is stored at offset 0x18 in the structure, but we have to take care that we are already at the offset 0x8 (InMemoryOrderLinks field) so we just jump 0x10 bytes to get the DllBase.
Here is the perspective of all required steps necessary to find kernel32.dll memory address:

My Paint skills are not awesome, but I hope you can figure out how it works. Just remember that navigating through modules is done using the “Flink” pointer representing the first 4 bytes we are placed on.
Do not be scared about this! As you will see, it is possible to do this in only 8 (more or less) lines of Assembly code.

Portable Executable file format

The Portable Executable is a file format used by executables and dynamic libraries (DLLs) on Windows system. The format describes the content of these files: the headers and sections containing all code and data used by PE files.
There is plenty of documentation on the Internet, but here I want to describe you only the necessary information required to write a shellcode: the overview, headers, sections and the export table.
A really short illustration on PE files:

As you can see in this picture, a PE file contains:
  • DOS (old Microsoft operating system) header
  • DOS stub – small program that prints “This program cannot be run in DOS mode”
  • PE headers (different useful information)
  • a section table (headers for sections)
  • sections (code and data sections)
A more detailed look will show us what a PE file opened in a hex editor contains:


The format is pretty complicated, but we just need to know how to parse the PE headers in order to get exported functions.
Let’s start with the DOS header. DOS header is represented as the following structure:

You can find the complete structure and all other required structures within “WinNT.h” header files of C/C++ compilers.
All PE files (EXE or DLL) will start with this structure. So, after we find a module in memory, at that memory address we will find this structure. You can recognize it by its first two bytes: “MZ“, this being the e_magic field representing the “signature” of the DOS header.
The only thing we need to know is the e_lfanew field of the structure. This field is located at offset 0x3C and it shows us the location of the PE header.
The PE header is a structure that contains the following information:

It contains the PE signature (you can see a “PE” string if you open a PE file with an editor), the FileHeader, a structure containing information like the number of sections (code and data), the “machine” type (x86, x64, ARM…) and “characteristics” determining among other information if the file is an executable (.exe) or a dynamic link library (.dll).
The OptionalHeader is a structure containing more useful information for us.

It contains information such as:
  • AddressOfEntryPoint – where the exe/dll starts executing code
  • ImageBase – where the DLL should be loaded (if possible) into memory
  • DataDirectory – information such as imported and exported functions
We are interested only on the last field, DataDirectory, because we need to get the exported functions. This is how a DLL works: it contains different functions and this functions are exported, so other application can just load the DLL into memory, find the exported functions and call them. As an example, “MessageBox” is an exported function from “user32.dll” (actually, there are two versions: ASCII and Unicode).
The DataDirectory field of the structure is an array of IMAGE_DATA_DIRECTORYstructures. The IMAGE_DATA_DIRECTORY is the following:

So at the end of the OptionalHeader structure there areIMAGE_DATA_DIRECTORY structures (16 actually). It is important for our scope to understand that the first one is the “export directory” data directory.
In order to go to the export directory, we just need to follow the VirtualAddress field of the structure which point to the start of the export directory. A DWORD represents a type on 4 bytes and a WORD is just 2 bytes. If you will sum all the sizes of the elements until the DataDirectory array, you will notice that there are 120 bytes (0x78) bytes from the beginning of the PE header to the beginning of the DataDirectory array. So at offset 0x78 we will find the virtual address (VirtualAddress field) to the export directory.
The export directory is the following structure:

From this structure we will use the following fields:
  • AddressOfFunctions – Address of an array of “pointers to functions”
  • AddressOfNames – Address of an array of “pointer to function names”
  • AddressOfNameOrdinals – Address of an array of ordinals (16 bit integers)
Let’s take as an example a DLL with three functions.
  • AddressOfFunctions = 0x11223344 —-> [0x11111111, 0x22222222, 0x33333333] – The 0x11223344 is a pointer to an array containing the addresses of the functions: 0x11111111, 0x22222222 and 0x33333333 are  the addresses of the functions.
  • AddressOfNames = 0x12345678 —> [0xaaaaaaaa -> “func0”, 0xbbbbbbbb -> “func1”, 0xcccccccc -> “func2”] – The 0x12345678 is a pointer to an array of pointers to function names: 0xaaaaaaaa is a pointer to the “func1” string representing the exported function name and so on.
  • AddressOfNameOrdinals = 0xabcdef —> [0x00, 0x01, 0x02] – The 0xabcdef is a pointer to an array of integers (on two bytes) representing the offsets of each function in the AddressOfFunctions array.
In order to get a function address by its name, we check the names by parsing the AddressOfNames array. First function (func0) will have the ordinal 0, second function (func1) will have the ordinal 1 and third function (func2) will have the ordinal 2. So if we are searching for the func2 function, we will access the element 2 (starting from 0) of the  AddressOfFunctions array.
Shortly, it is like this: function_address=AddressOfFunctions[ Ordinal(function_name) ].
Don’t be scared about this, as you will see, it is possible to do all this stuff in about 15-20 lines of assembly code.

Assembly language

Even if it is possible to write shellcode in C/C++ as you can see in this article, if you want to properly understand what is does, how it works and how can you modify it, you should be able to understand and write assembly code.
In this section I will provide only a few basics on the assembly language, please do not rely on this section and read a good article such as this one in order to properly understand ASM. The descriptions within this post will not be complete, I just want to cover some common operations in order to be able to write a simple shellcode.
In order to avoid different complications, I will write all the examples below using inline assembler on the Microsoft Visual C++ Express Edition compiler. However, you may find more convenient to use an assembler such as MASMNASM or YASM.
Let’s start with the “variables”. The processor uses different registers (think about them as variables) in order to store temporary data. They have different purposes, but here we will treat them as “global variables”. For a better description you can read this article.
There are a few general purpose registers: EAX, EBX, ECX, EDX, ESI and EDI. Each of them can store 4 bytes of data. Also, the lowest 2 bytes of them can be referred as AX, BX, CX, DX, SI and DI. The last byte is accessible as: AL, BL, CL, DL. The following picture describes this:
Let’s say the execution of our program starts at address 0x12345678. There is a special register that holds the current address of execution called EIP (Instruction Pointer). After executing an instruction, this register will be automatically changed to the address of the next instruction.
Ok, now that we have “variables”, let’s see what can we do with them. There are multiple instructions we can use in order to do something useful.
Instructions:
  • mov destination, source – Will “move” the value from source to destination, will affect the source
  • add destination, source – Will add the source to the destination or destination = destination + source
  • sub destination, source – Will substract the source from the destination or destination = destination – source
  • inc destination – Will increase destination value with 1
  • dec destination – Will decrease destination value with 1
A few examples:
1
2
3
4
5
6
7
; Comments can be specified by starting with a ;
 
mov EAX, 5   ; Put value 5 in the EAX
add EAX, 2   ; Add 2 to EAX, EAX will be 7
inc EAX      ; EAX will be 8
mov EBX, 2   ; Store value 2 in EBX
sub EAX, EBX ; EAX will be 6
You can test this on Visual C++ like in the following picture:
It is possible to place a breakpoint, a point where the Visual C++ debugger will stop, by clicking the left grey line. When you will start the program it will stop at the specified breakpoint. Now, on bottom you will see a “Watch1” window. That is the place where you can add the register names in order too see their values. So add EAX, EBX and so on and watch them.

You can press F11 to execute the instructions one by one and you will see in the watches window, how the value was modified. Oh, or you can just keep the mouse pointer over the register names in order to see their values. Just note that this is very basic, you can use a debugger like Immunity Debugger for an advanced functionality, but to keep it simple you can just use this one.
The control flow of the program will pass through some decision sequences, to compare two values in order to take different actions. First of all, you need to know that you can use labels. As you will see, labels are just “names” for different locations of code. And you can use “jumps” to reach them.
Useful instructions:
  • jmp address/label – Will unconditionally jump to a label or memory address
  • cmp destination, source – Will compare destination to source by substracting (without affecting the operands) the source from the destination. The “result” will not be saved, just remember that if the source is equal with the destination, a flag, called “Zero Flag” will be set. This flag will be used later by the next conditional jumps
  • jz address/label – Will jump to the specified label or address if the “Zero Flag” is set (jz = Jump if Zero), so if we had before a “cmp” instruction where the parameters where equal, the flag was set and the code will jump to the specified address/label. If not, nothing will happen, the execution will go to the next instruction
  • jnz address/label – The opposite of jz (jnz = Jump if Not Zero), the code will jump to the specified address if the Zero Flag was not set, so if the cmp instruction operands where different.
There are many other jump instructions available, but this should be enough for the beginning. As an example, you can try the following code:

We can go now to an important part of ASM programming: the stack. The stack is a place in memory where you can store data. Think about it as a memory space where you can put data like you can put plates, one above each other and you can get them only from the top.
There are two useful instructions to work with the stack:
  • push value – Will put the value on the stack
  • pop register – Will take the value from the top of the stack and it will store it in the specified register
There are two registers that “point to the stack”
  • ESP register (Stack Pointer) – points to the top of the stack
  • EBP register (Base Pointer) – points to the “base” of the stack. We will not cover this here
A few important things happen when we work with the stack. Let’s say the ESP, the top of the stack, is the value 0x11223344. If we push some data (4 bytes) with the “push 0xaaaaaaaa” instruction, the 0xaaaaaaaa value will be put on the top of the stack and the ESP value will DECREASE with 4 bytes. So we can say that the stack grows to lower addresses. After the push instruction, the ESP will be 0x11223340
If we get data from the stack, everything happens the other way: the data is removed from the stack (actually, it is still there, for optimizations) and the ESP value is increased with 4 bytes.
It may look difficult but it is not. Example:


Thinking about the maths of the stack, we can assume that if we put 0x20 bytes on the stack (by using 8 push instructions, 0x20 = 32) we can easily clean the stack by just modifying the ESP value: add ESP, 0x20. This is easier than 8 pop instructions.
We can now call functions. There are two very common methods to call functions, calledstdcall and cdecl. The Windows API uses stdcall calling convention (method) and we will discuss only this one. However, they are similar, you can find more information here.
Let’s take the following function as an example:
1
2
3
4
5
6
7
int function(int x, int y)
 
{
 
    return x + y;
 
}
We want to call function(0x11, 0x22). We need to know the following things:
  1. put the parameters values on the stack from the right to the left
  2. use “call function” instruction to call the function
  3. the call instruction will automatically put on the stack the address of the next instruction after the call instruction itself (and the ESP will be also decreased)
  4. we can see the result of the function in the EAX register

So after the execution of this function we will have the 0x33 (0x11 + 0x22 = 0x33) value on the EAX register.
So theses are the basics. However, we will also use some other instructions in our shellcode, instructions such as:
  • xor destination, source – It is a binary operation, but we will just use it as “xor eax, eax” – The result of this instruction is that it changes the value of eax to 0. We use it to avoid NULL bytes
  • lea destination, source (Load Effective Address) – Is used to put into the destination, the memory address specified by the source.
  • lodsd – Put in EAX register the value at the address specified  by the ESI register
  • xchg destination, source – Exchanges the values of the operands: the source will have the value of the destination and the destination will contain the value of the source
ASM is a difficult language but if you take it step by step it is easy to understand it.